
You’ve noticed a performance problem #
First steps #
I hope everyone already knows that to check the performance of a Compose app, you need to run it in release mode. Development mode is designed for quick iterations and skips a lot of build-time optimizations.
So first of all, if you see that the app is lagging and dropping frames, make sure you’re not running it in development mode.
If the problems are still there even in a release build, then, of course, you need to figure out what went wrong.
Don’t jump straight into the hardcore stuff! First, just take a sensible look at what’s happening inside the app.
Nobody knows your codebase better than you do. Maybe, by accident, you’re decoding a large JSON file on the UI thread. Or maybe you’re making a database query. And so on. 😉
Stability of composable functions #
If you’re now sure that your code is generally fine, the next step is to check the stability of your composable functions. How it works, what the limitations are, and what analysis tools are available are all explained very well in the official documentation. It’s also worth mentioning this cool plugin, which highlights problem areas right in your code.
👉 But be very careful! There’s nothing worse than premature optimization. Compose is already very fast on its own. And in most cases, it handles optimizations by itself. You should only worry about manually tuning stability when you have real problems.
Profiling the app on Wasm #
If you’ve already tried everything you can and you’re still not happy with the performance, it’s time to run a profiler. In this article, I’ll focus on the Wasm target. I’ve noticed that developers complain about browser’s performance often than about other platforms. The reason, of course, is the single-threaded nature of the browser and non-web oriented design of libraries (e.g. long tasks with no suspension points in between). But the good news is that if you fix the problems in the browser, things will most likely work well on the other platforms too, or even better.
Recording in Performance #
So, you’ve started your Compose app in production mode with ./gradlew :webApp:wasmJsBrowserProductionRun.
You’ve opened the problem area in the app and want to understand what’s going on. Let’s go through it step by step:
- Open the browser’s developer tools and go to the Performance tab.
- Click the record button.
- Reproduce the problem in the app.
- And stop the recording.
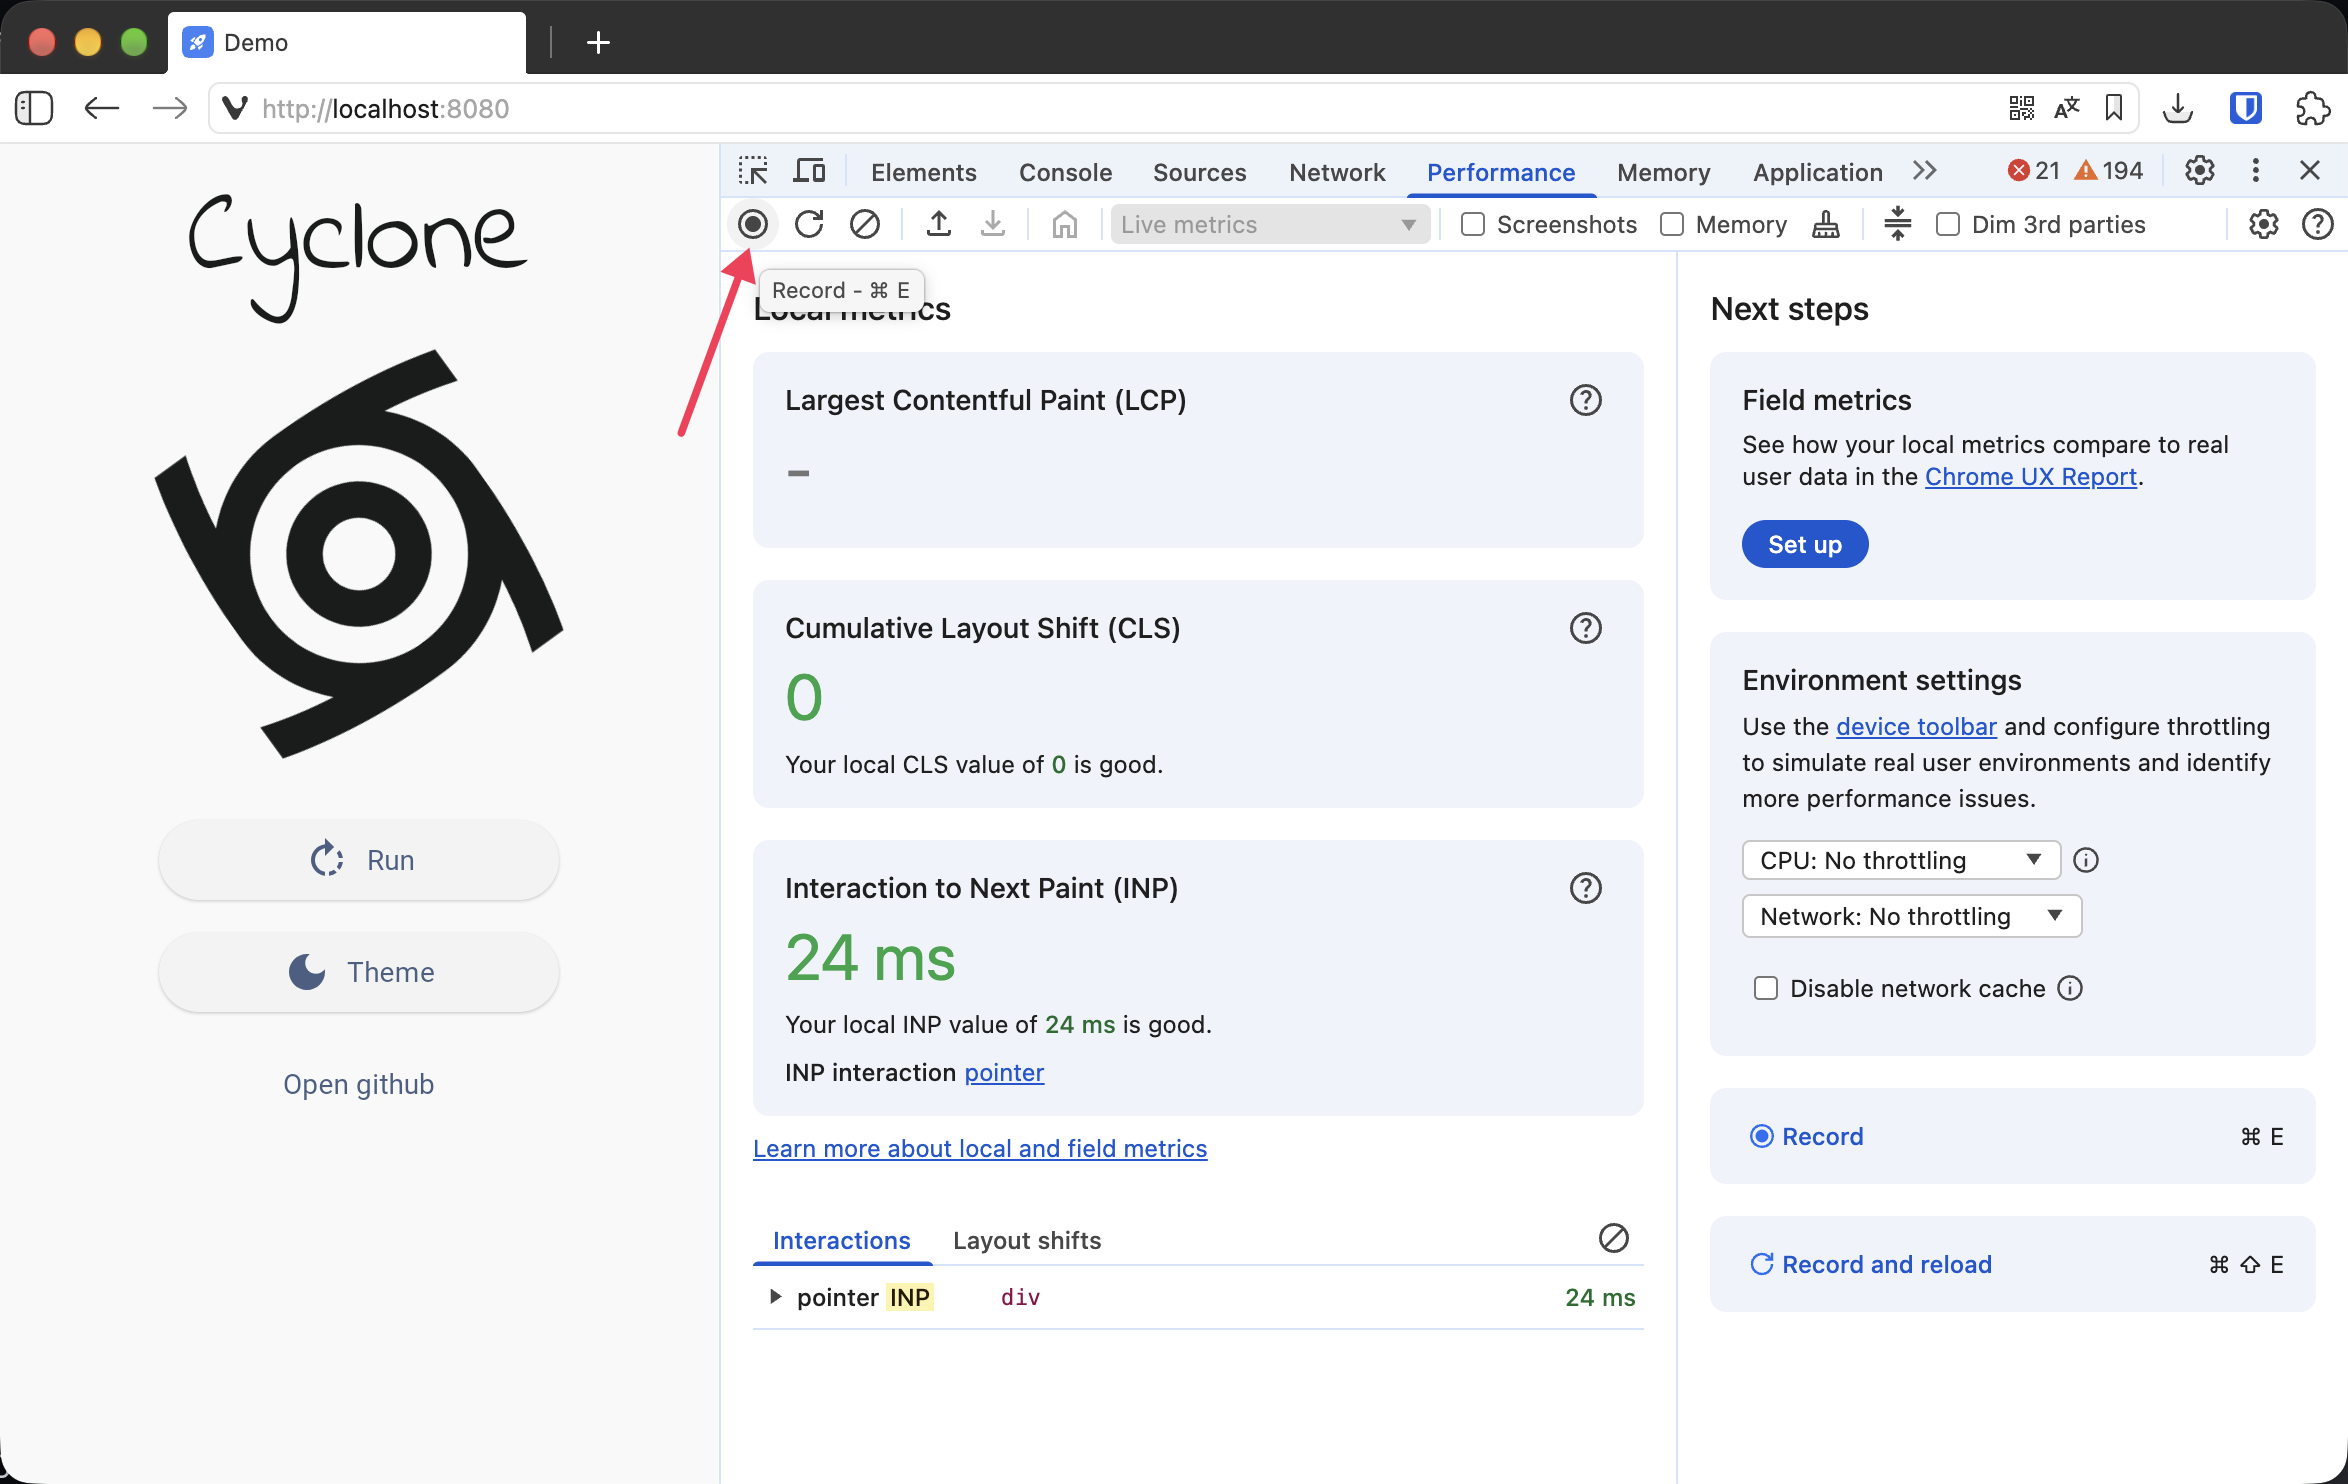
After that, you’ll immediately see all the problems in the view. Frames that took longer to render than they should will be marked in yellow. As you can see, things look pretty good in my case.
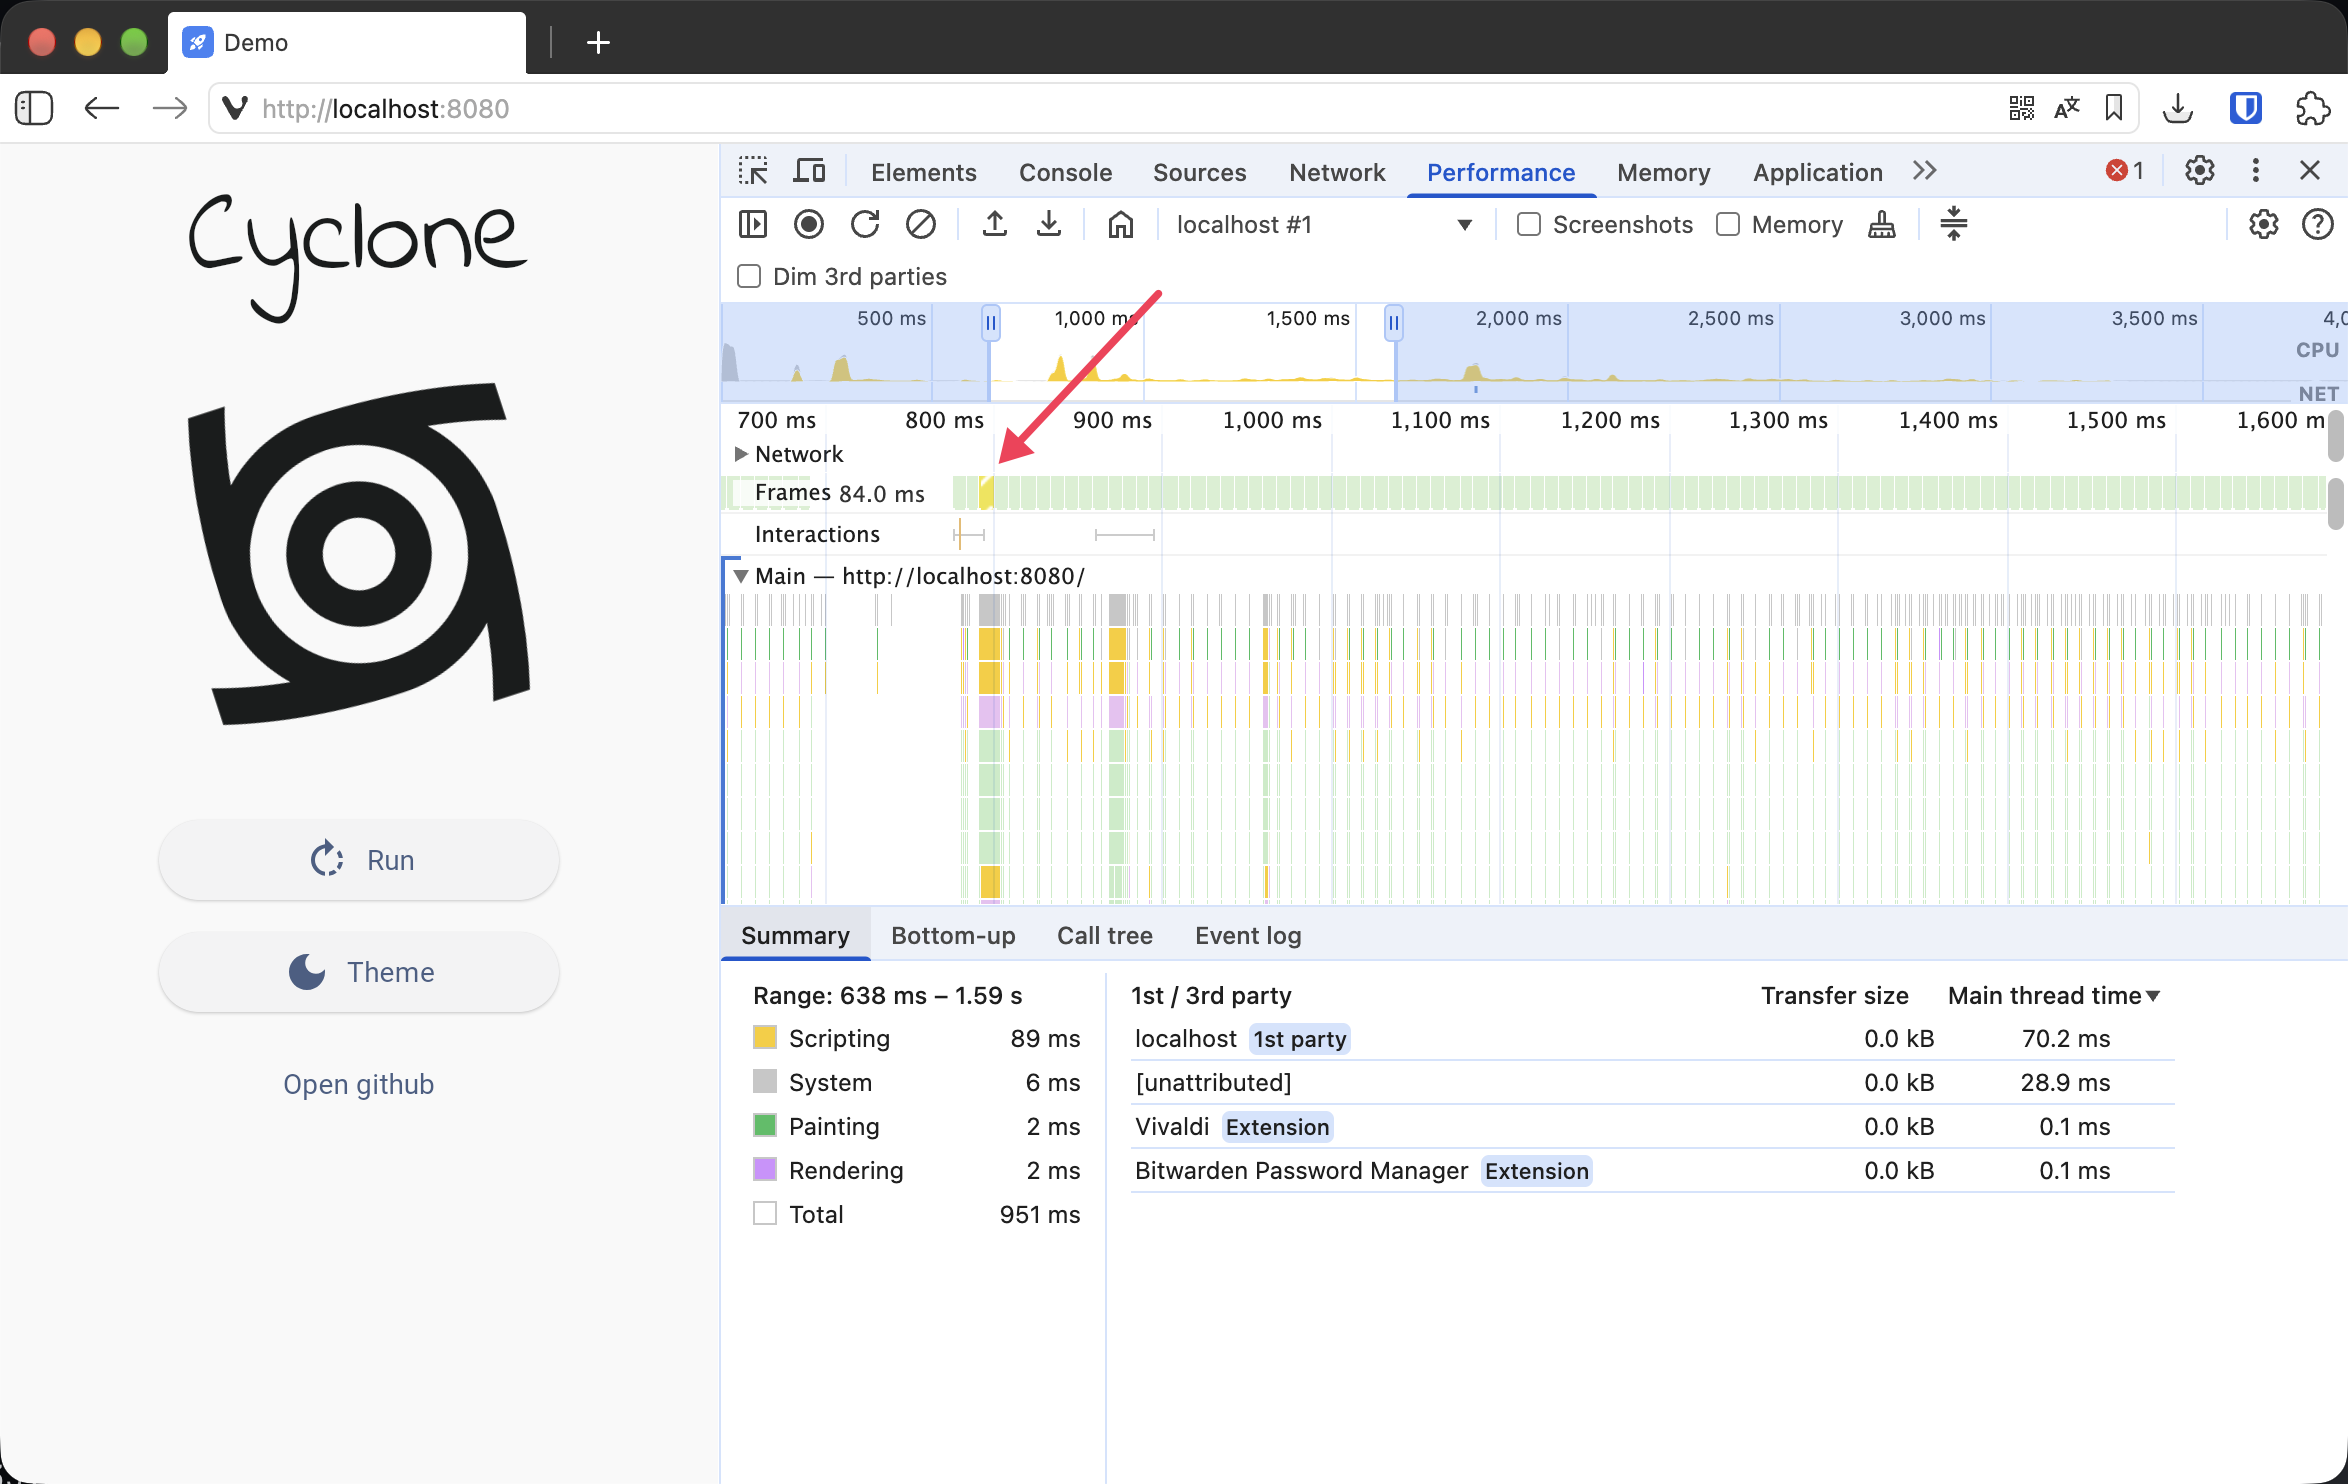
But one frame still took longer to render than expected. That’s why it’s marked in yellow. At that moment, I turned on an animation in the app and switched the theme from light to dark and back. Let’s try to find the source of the problem.
Zoom in on the problem frame so we can see which tasks were running at that time. And click the top-level Task item. This is the task that was sent to the main thread. In the bottom panel, select the Bottom-up tab. Here we can see all the functions called within this task. Or can we?
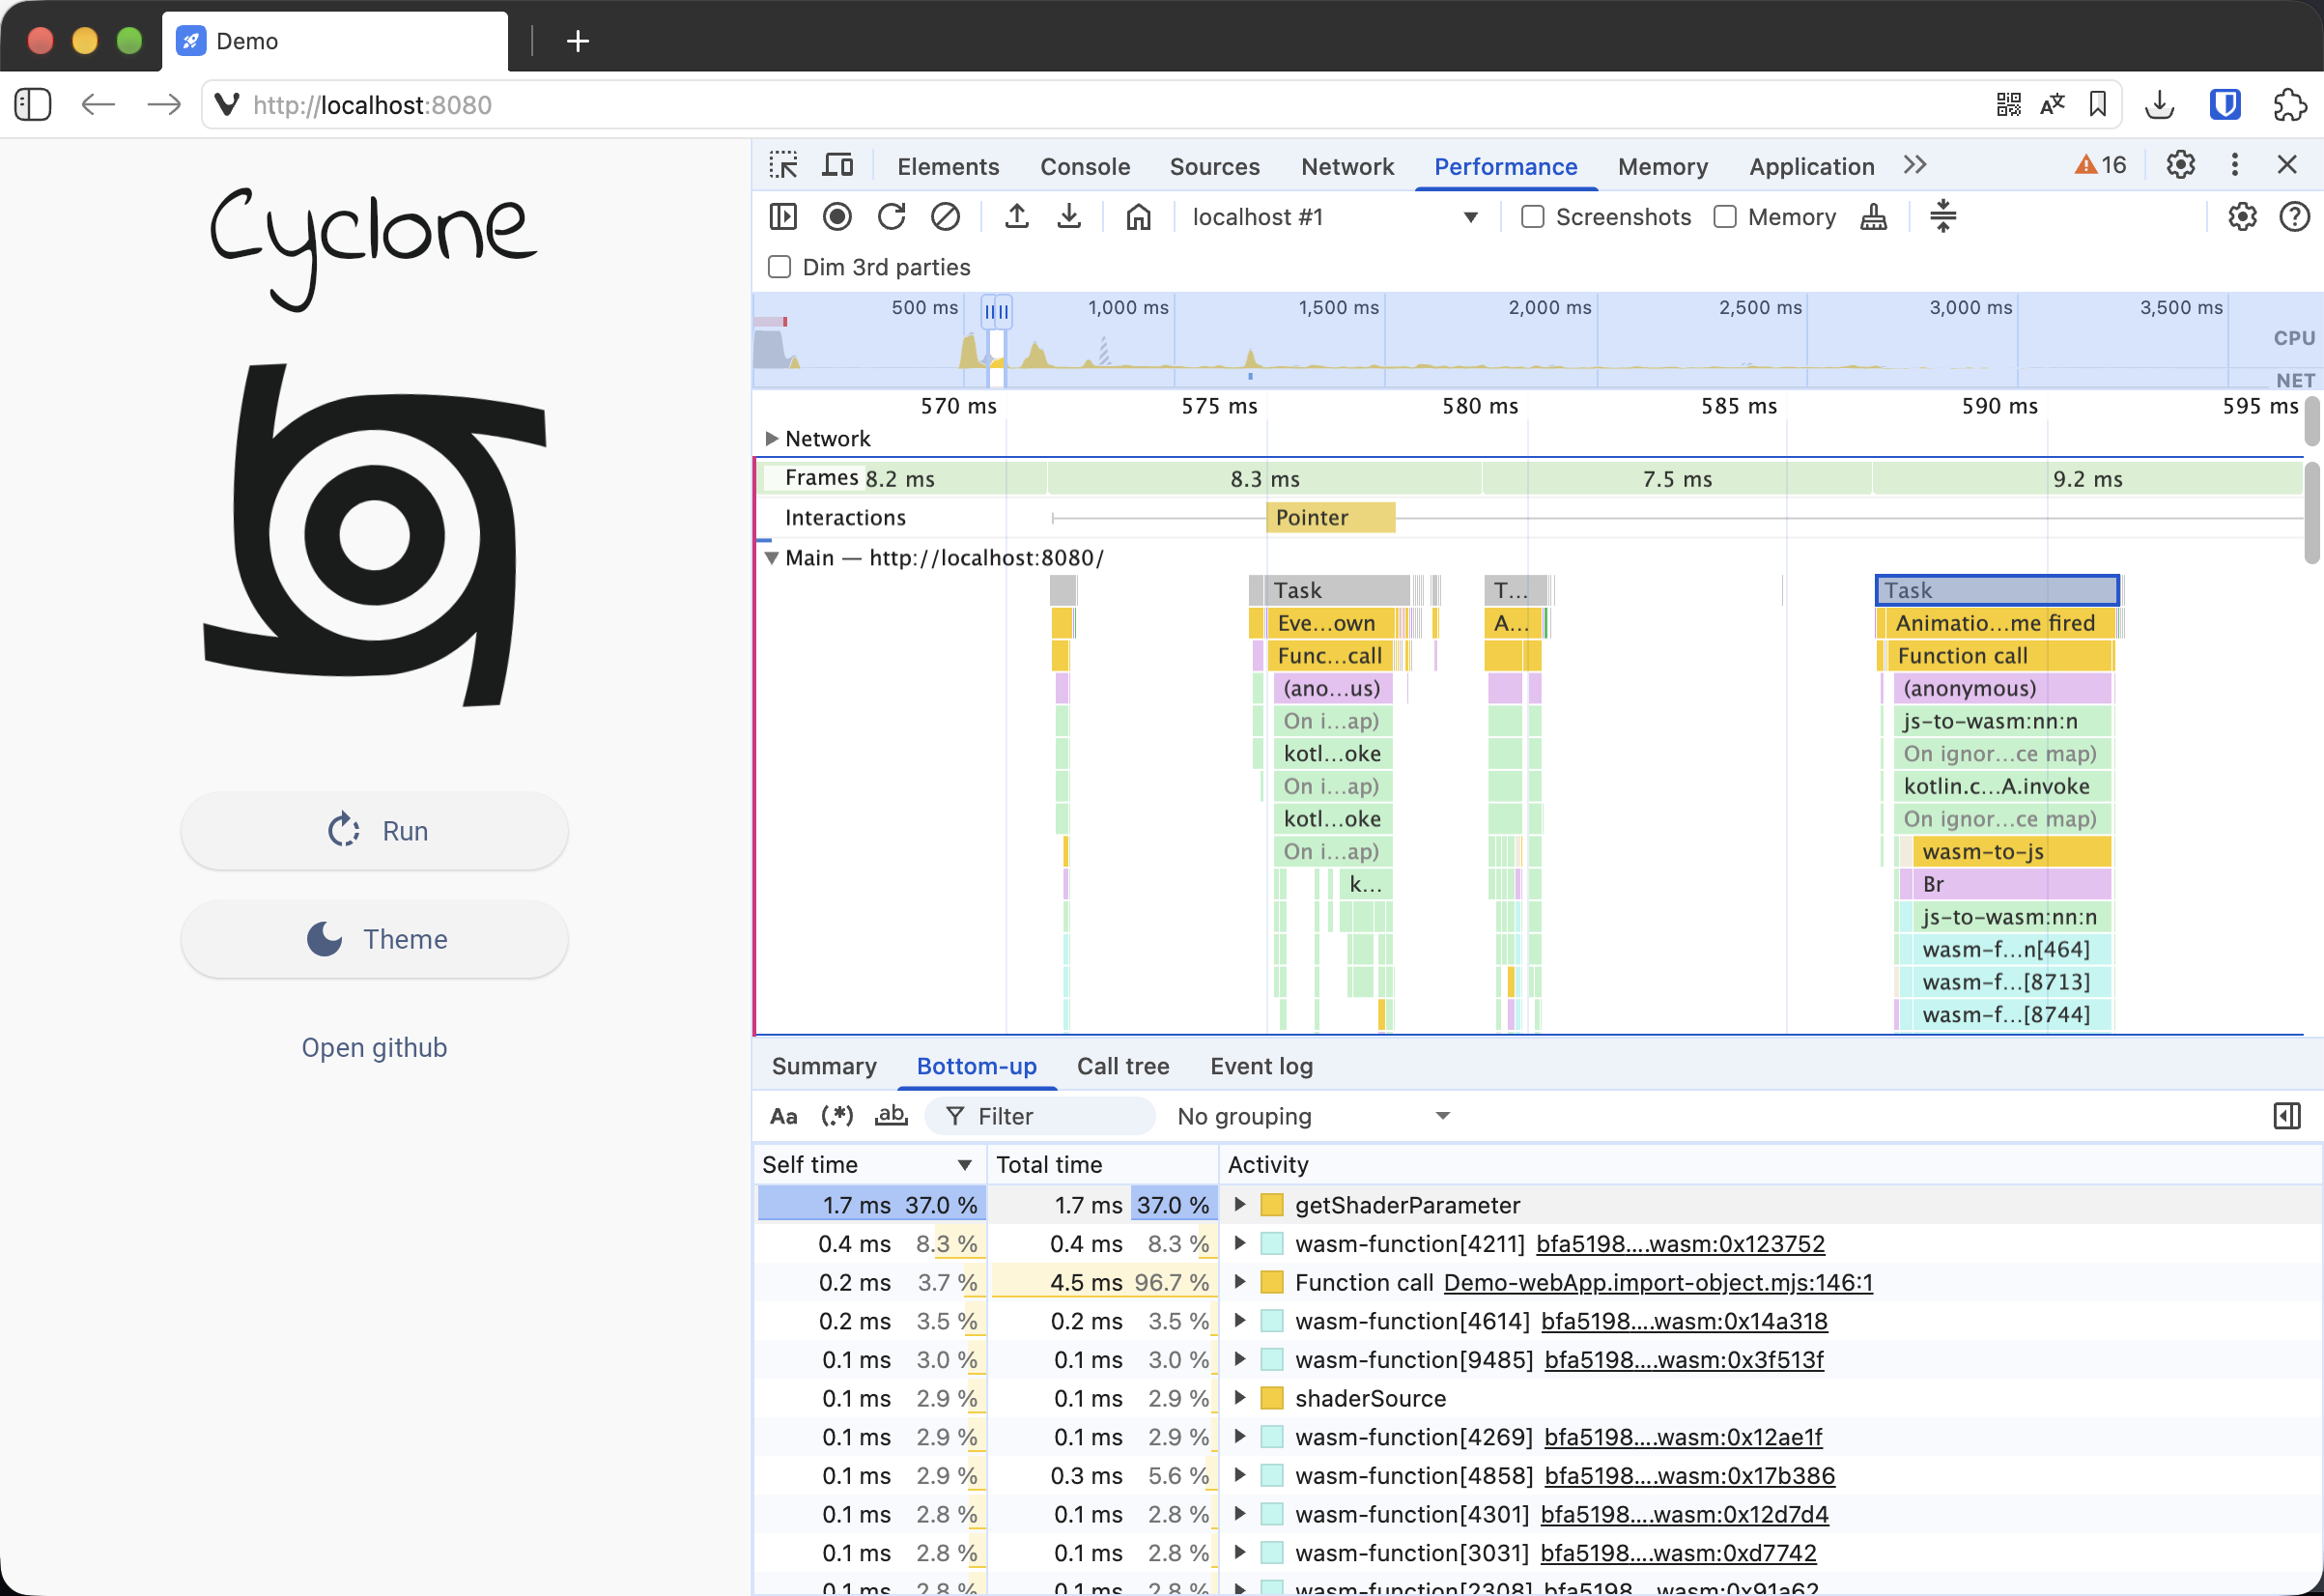
The function names are hidden. We can only see their codes. That’s hard to work with. The thing is, in a release build, all the original function names are stripped out. But I know how to fix this!
Bringing back Wasm function names #
Add the following lines to the build.gradle.kts file at the project root:
subprojects {
    tasks.withType<org.jetbrains.kotlin.gradle.targets.wasm.binaryen.BinaryenExec>().configureEach {
        binaryenArguments.add("-g")
    }
}
This flag lets us keep the original function names when building our app’s Wasm binary. Now let’s repeat all the previous steps and see what we get.
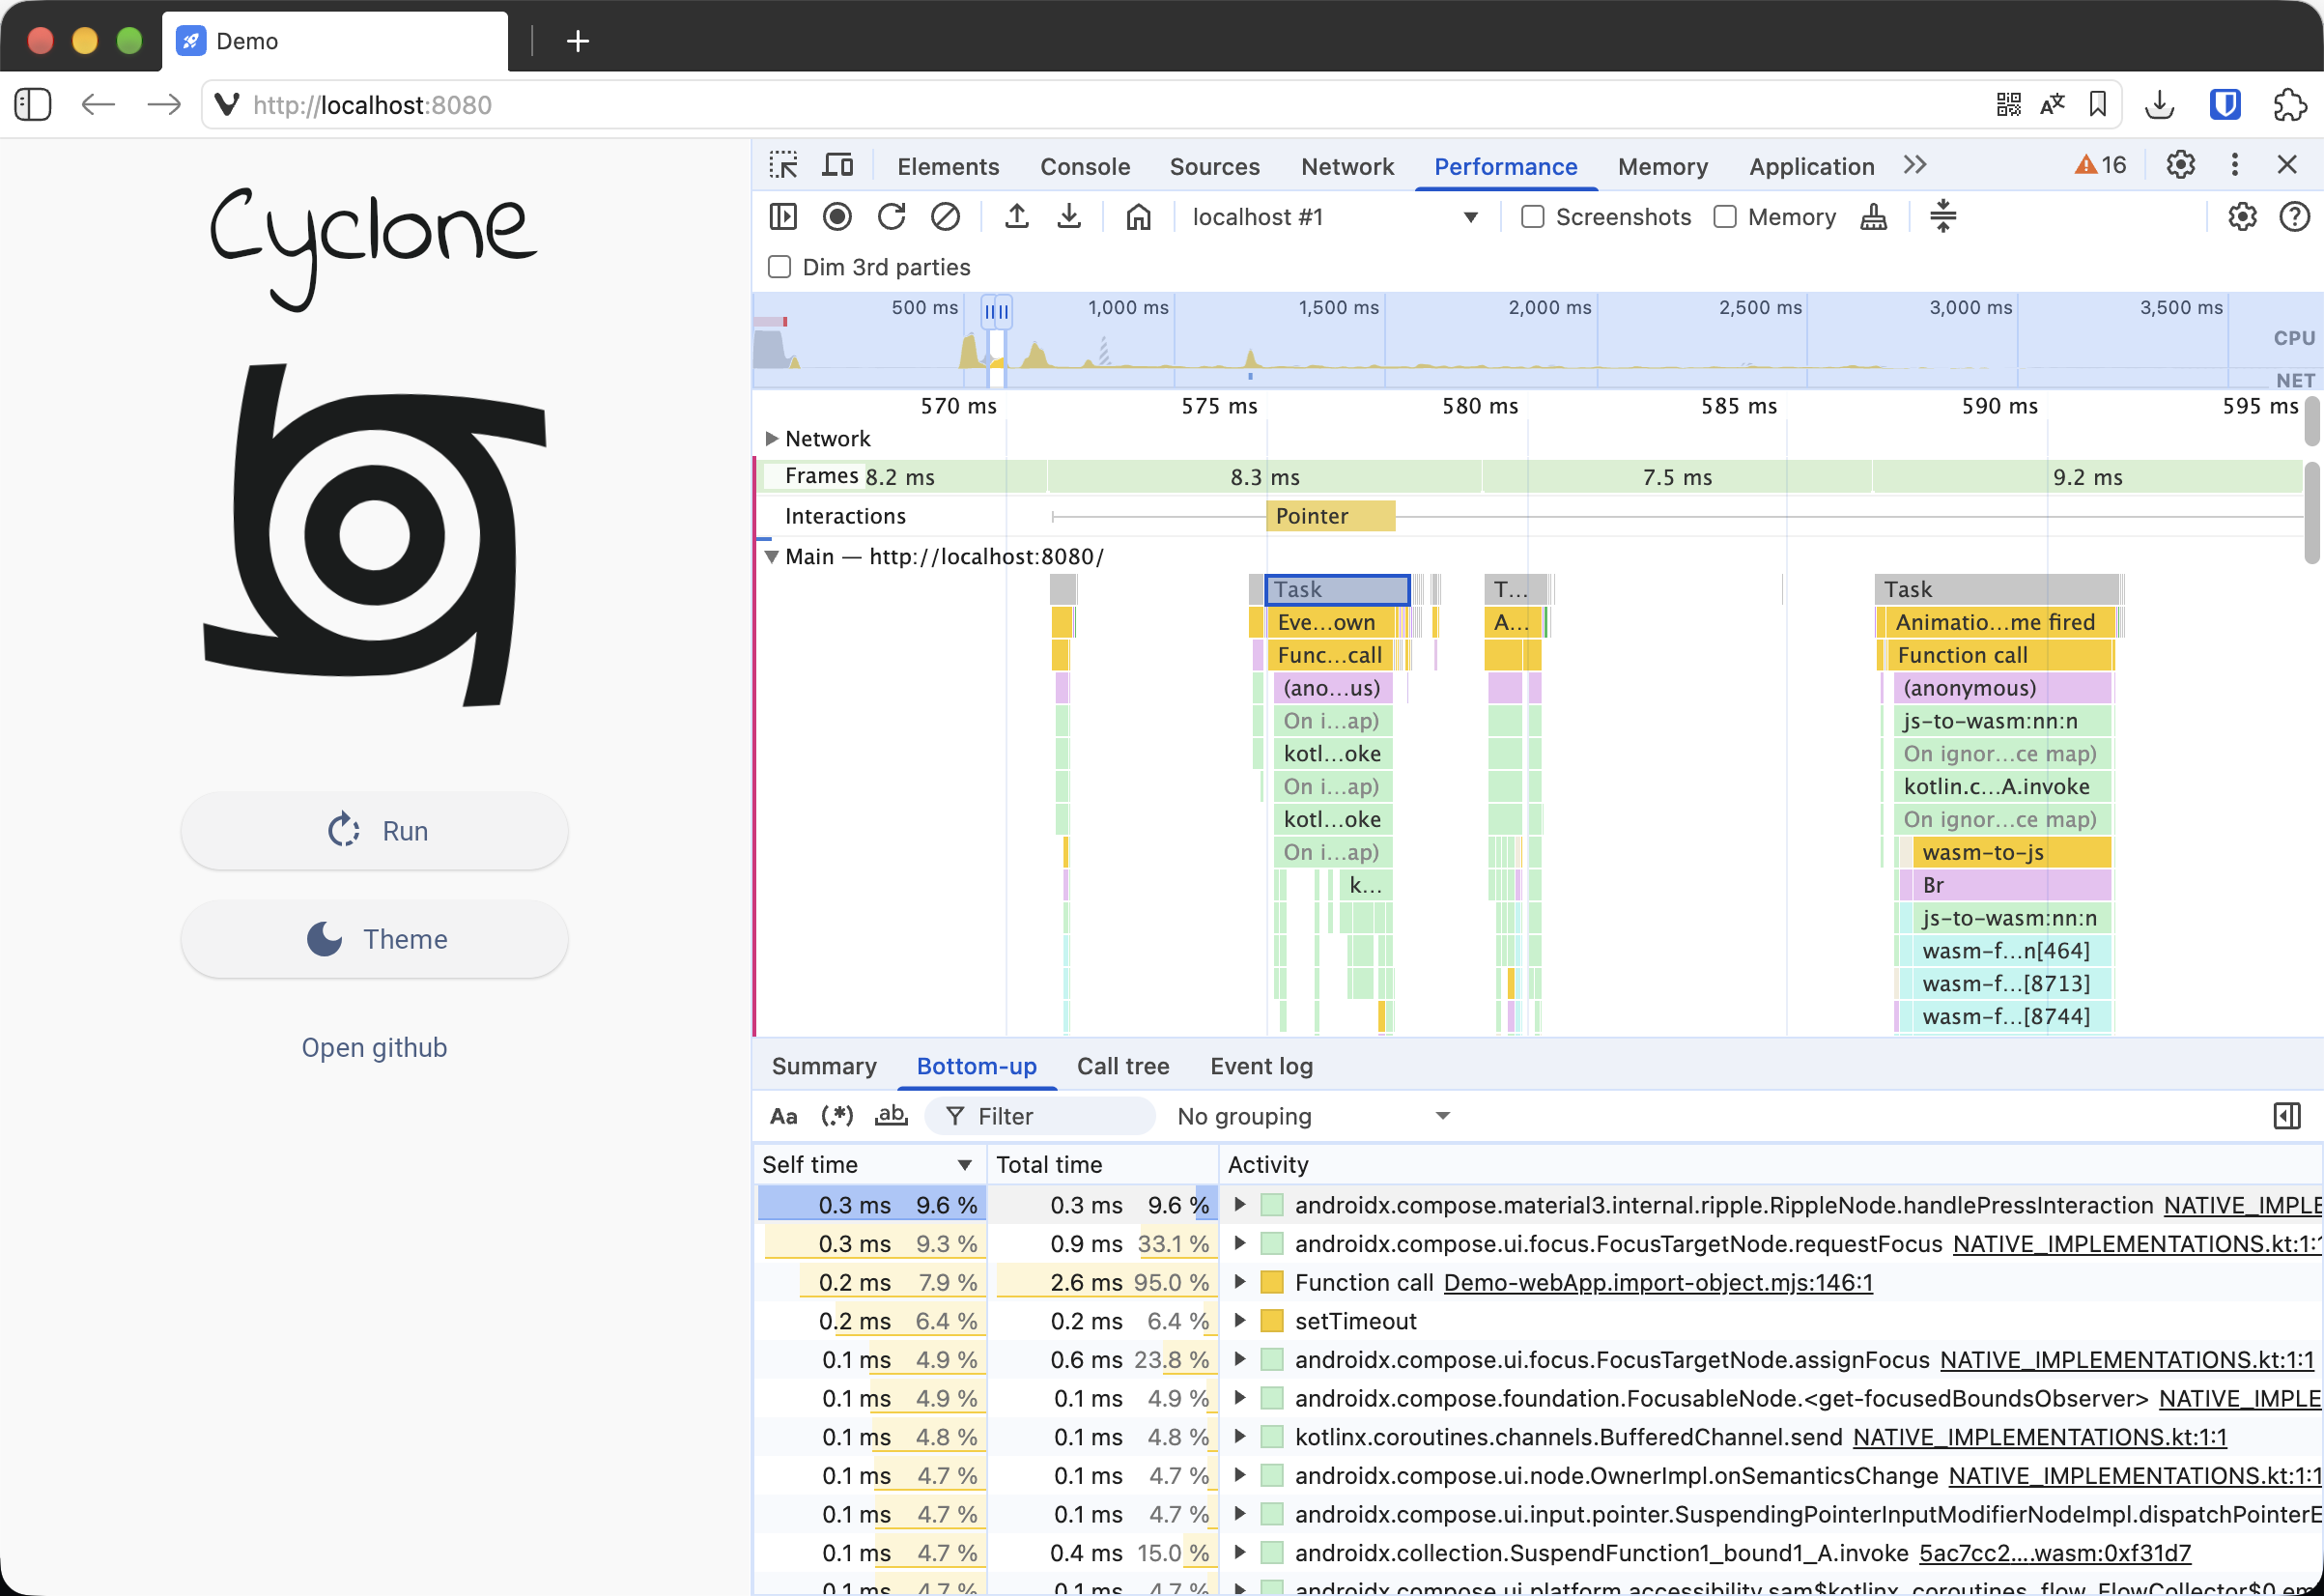
Much better now. Now we can see the actual composable functions from our app and the libraries we use. And use them to find problems. But that’s not all. You may still come across Wasm functions with their names stripped out.
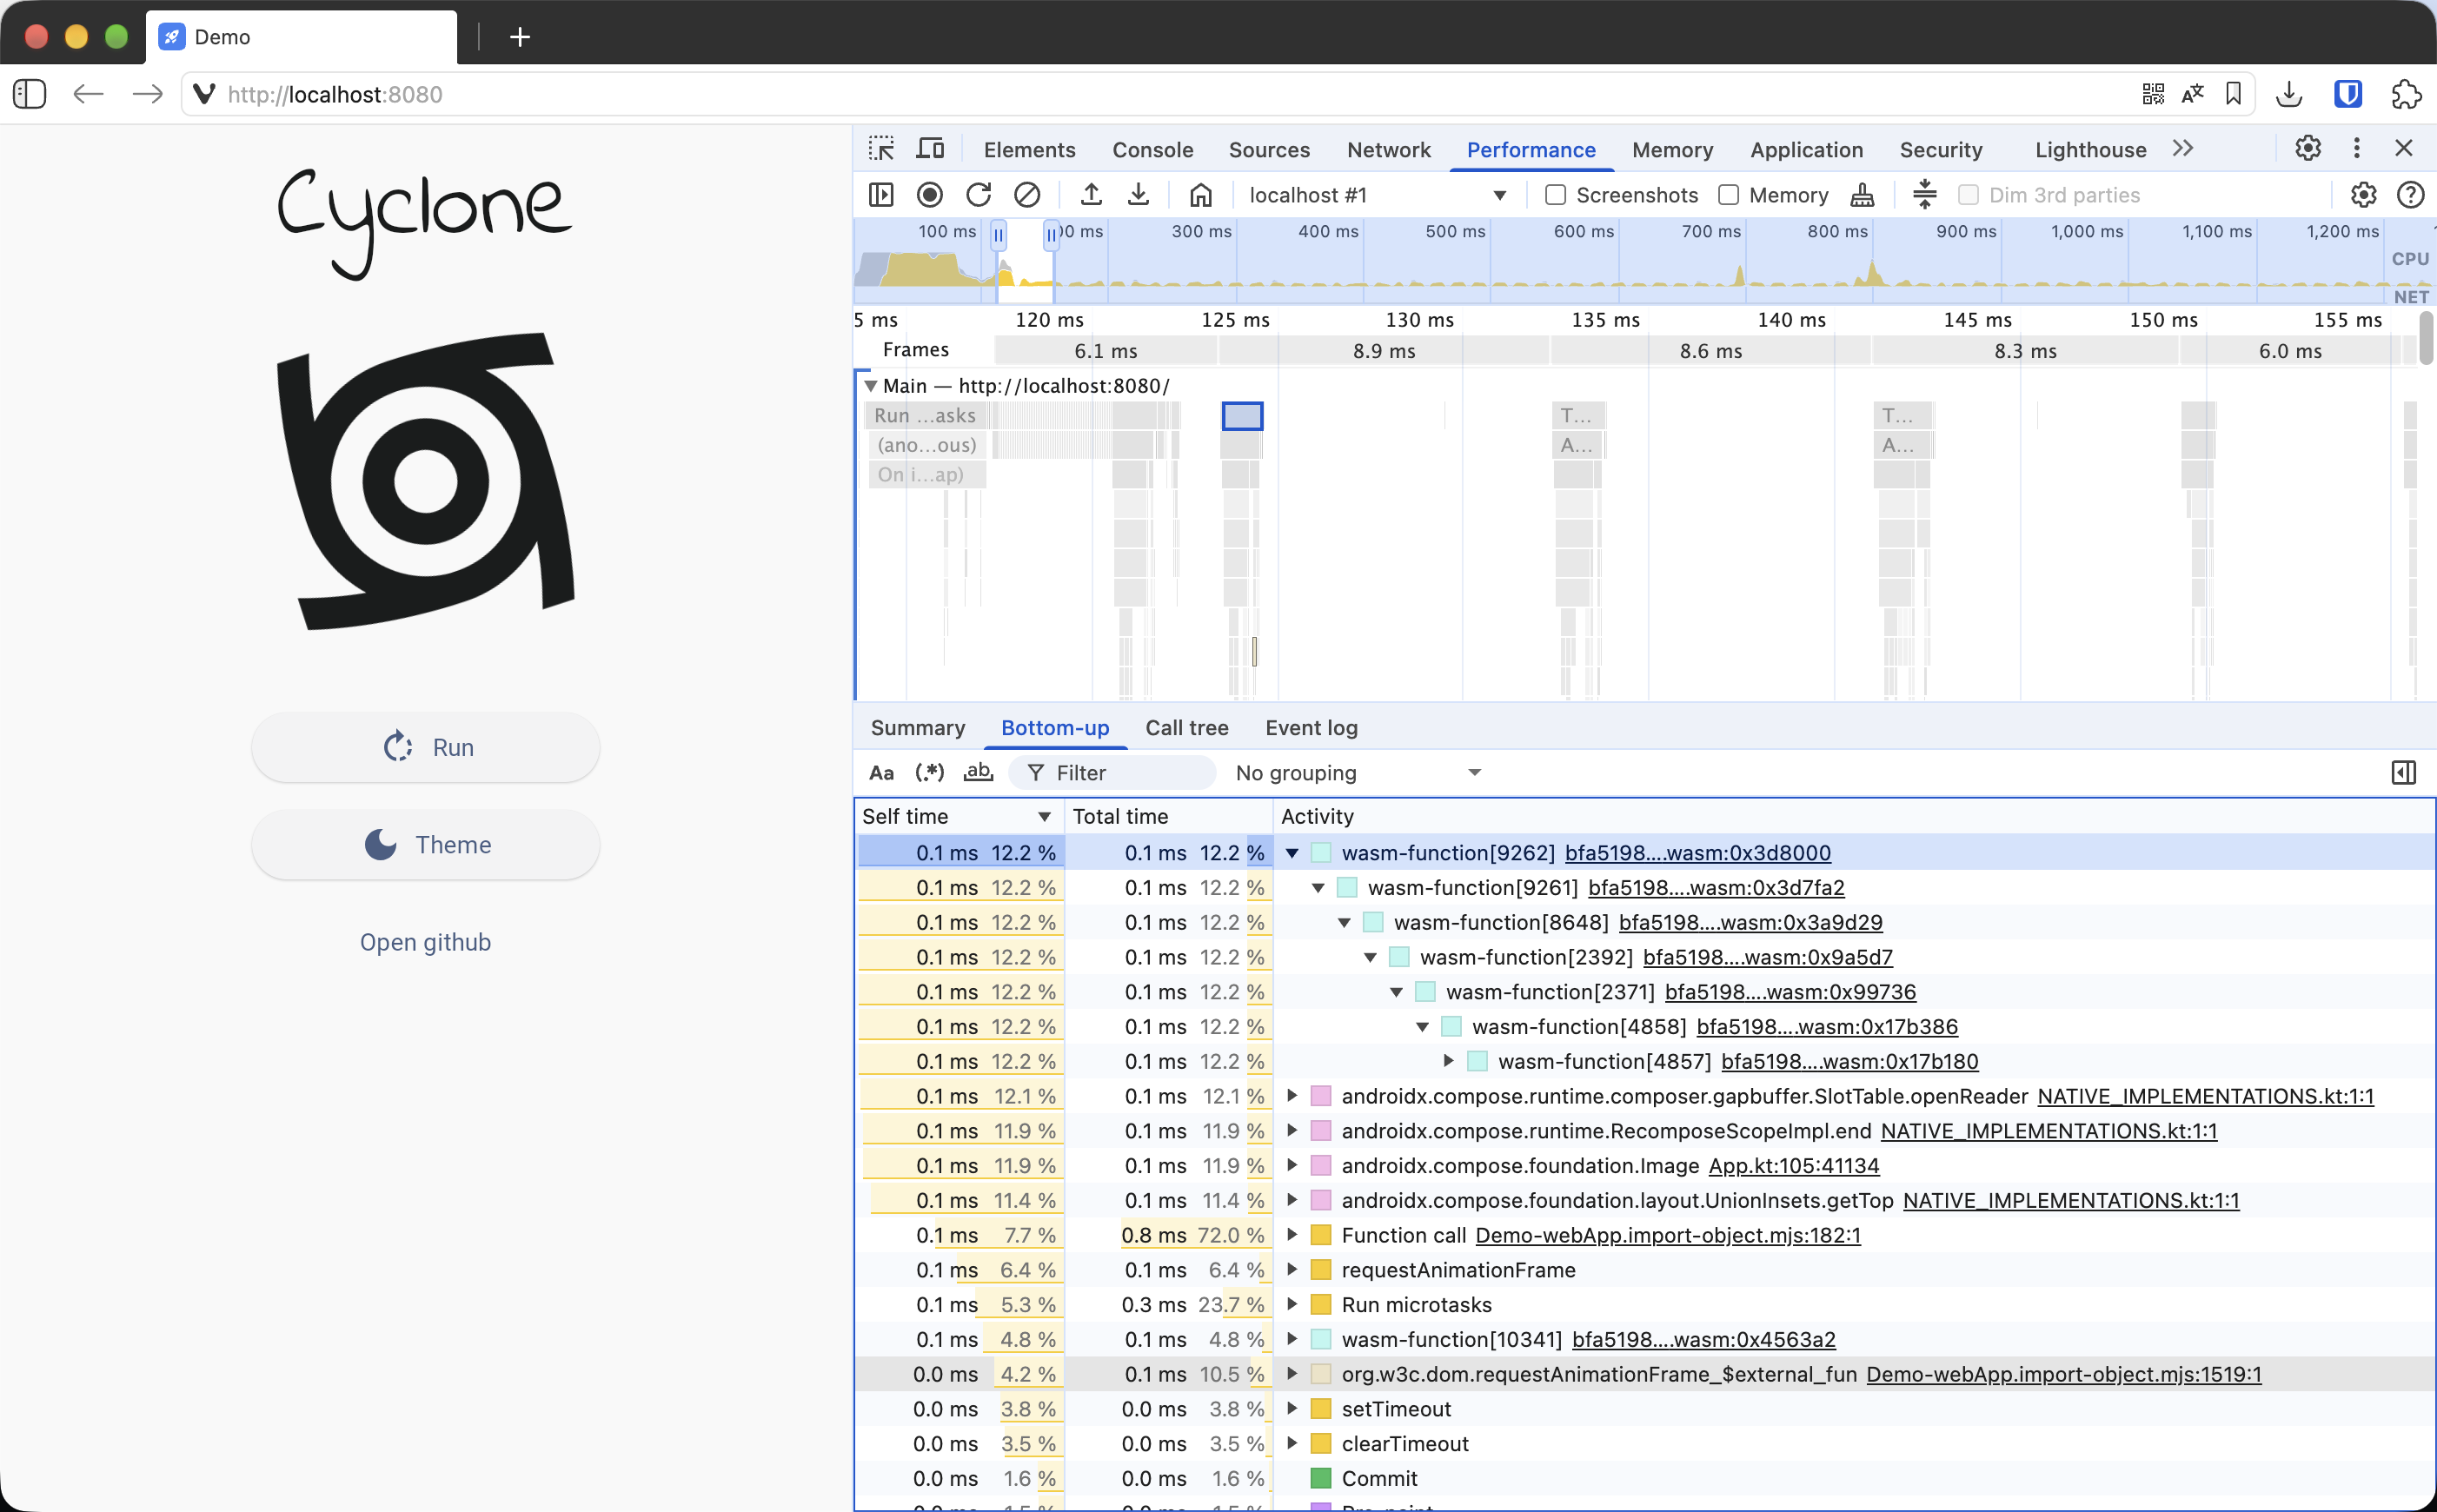
That’s because our setting only preserved the original names of Wasm functions built from the app’s code. But under the hood, when building the web app, the Compose Gradle plugin pulls in prebuilt Skiko Wasm binaries. Which, of course, are heavily optimized. But if you want to profile Skiko too, I’ll show you how!
Adding Skiko Wasm profiling artifacts #
First, add a new Maven repository to settings.gradle.kts (since we don’t publish these special artifacts to Maven Central):
dependencyResolutionManagement {
    repositories {
        ...
        maven("https://packages.jetbrains.team/maven/p/cmp/dev")
    }
}
Then add the following lines to the build.gradle.kts file at the project root:
subprojects {
    configurations.configureEach {
        resolutionStrategy.eachDependency {
            val isSkikoJsOrWasm =
                requested.group == "org.jetbrains.skiko" &&
                        ("-js-" in requested.name || "-wasm-" in requested.name)

            if (isSkikoJsOrWasm) {
                useVersion(requested.version + "+profiling")
            }
        }
    }
}
This makes Gradle download the special profiling artifacts for Skiko. Let’s rebuild the app again and check the result.
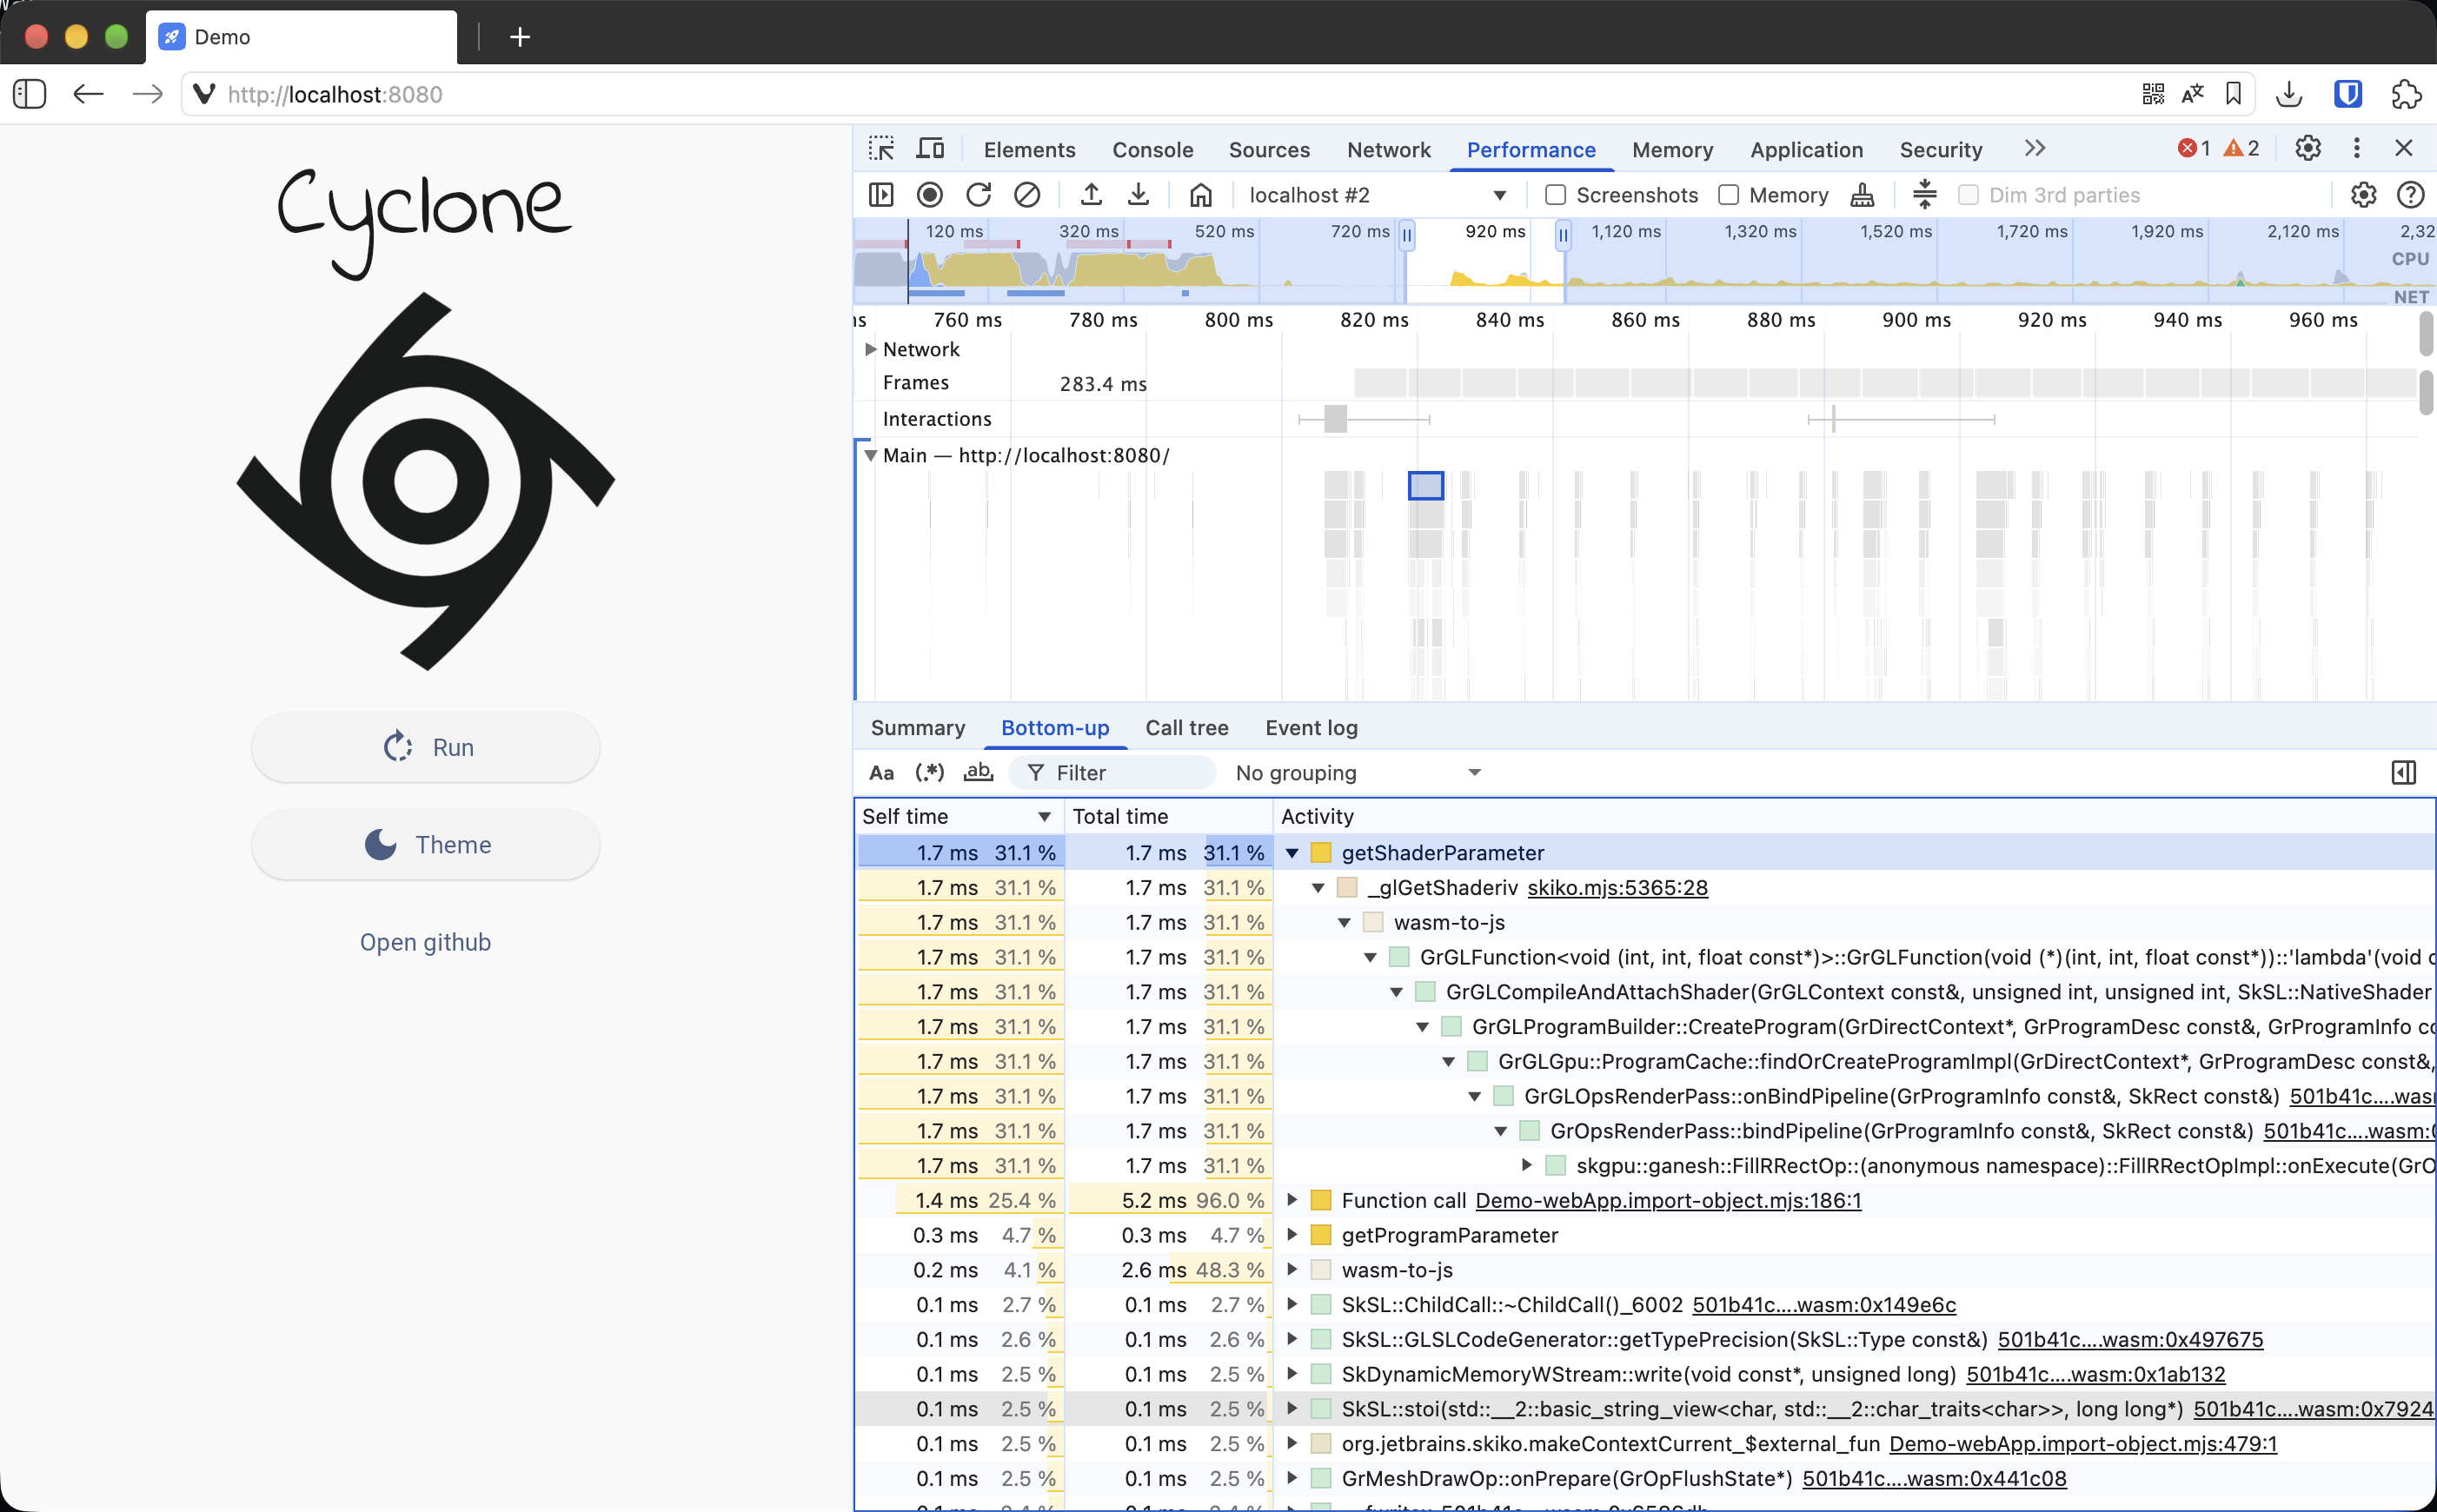
Now you have full information about all the calls inside your app. You can save the trace file and let your agent take a look at it 😅
Comments